UNLOCK THE MOST PREDICTIVE DATA IN BASKETBALL

WIN MORE WITH ADVANCED DATA
🏀 Player Location Data: X/Y coordinates of all 10 players on the court for every NCAAM, NBA and WNBA game from the past two seasons.
🏀 Historical Shot Data: Play by play data that contains ShotQuality data and metrics including shot type data, expected probabilities, shot distance, defender distance and much more.
🏀 ShotQuality Scores: Post game ShotQuality Scores generated from our proprietary location data and shot algorithm. Coverage from more than 137,000 games since 2011
🏀 Live ShotQuality Scores: Point-in-time ShotQuality Scores available throughout a live game
ShotQuality's Trading Tools Suite
Enhance Trading operations and improve live margin through Live ShotQuality Scores

Purdue
Halftime
Sun Jan 28

Gonzaga
| 40 | SCORE | 36 |
| 31 | 🏀SHOT QUALITY SCORE | 28 |
CBB Edge: 60% Win Rate on Under
- ◉ Game Clock: Applies to any point through 10 minutes left in the second half
- ◉ Actual Total Minus SQ Total: A 5-point or greater difference between the actual score and SQ score, where teams are overperforming expectations in aggregate
- ◉ Pregame Total: Greater than or equal to 142

Purdue
Final
Sun Jan 28

Gonzaga
| 80 | SCORE | 68 |
| 63 | 🏀SHOT QUALITY SCORE | 59 |
SHOTQUALITY TEAM RANKINGS
NBA
NCAA
Case Studies
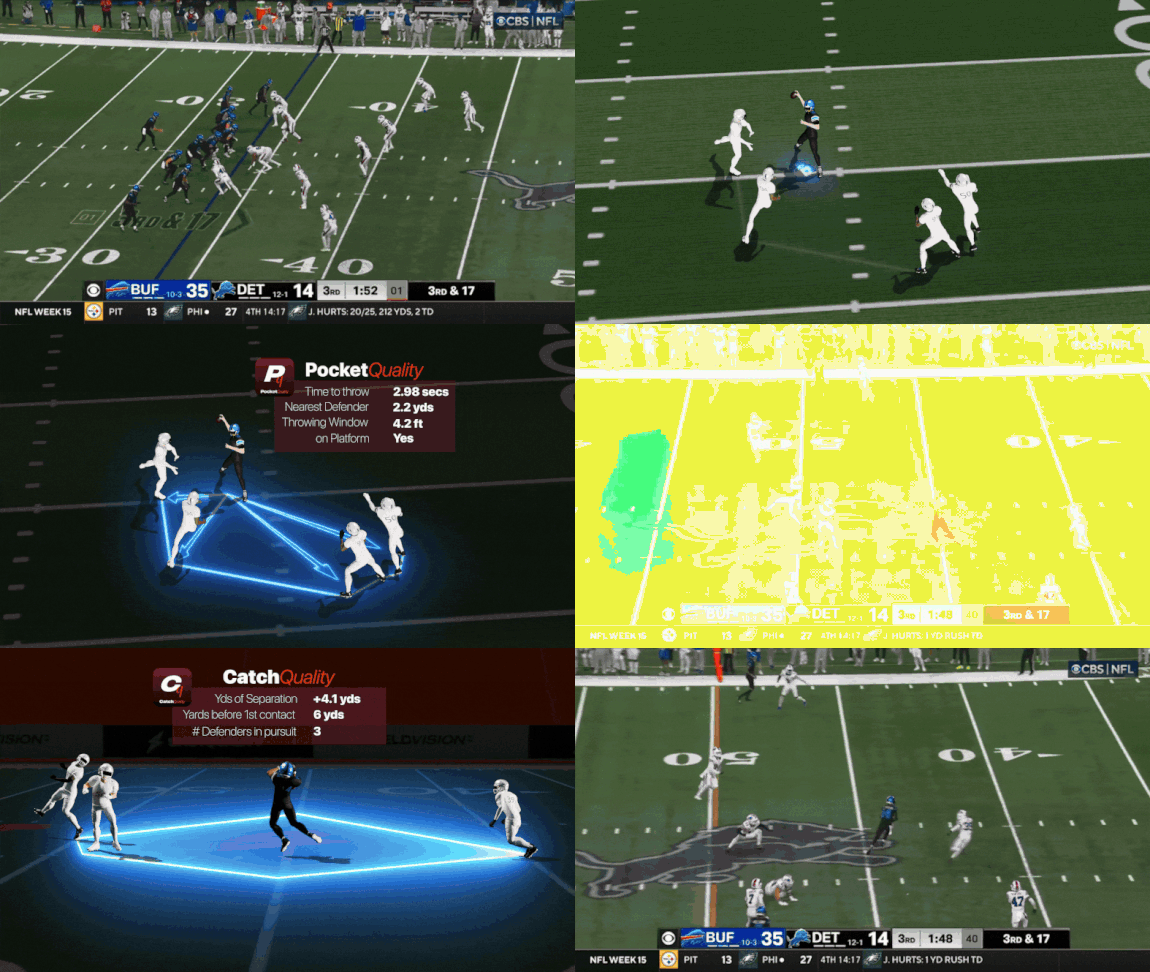
Changing the Game: ShotQuality Partners with Field Vision to Launch a New Standard for Measuring Offensive Performance in the NFL
New York, N.Y. – ShotQuality, a leader in sports data extraction who developed the ShotQuality metric - a standard for measuring expected performance in basketball, has partnered with Field Vision, an innovative football analytics company, to create Drive Quality, a real-time metric quantifying offensive performance. By leveraging ShotQuality’s computer vision data extraction techniques and Field Vision’s deep data science and football expertise, this collaboration delivers unparalleled live insights and projections to fans, bettors and sportsbooks.

ShotQuality x Fuzzy Yellow Balls
New York, N.Y. – ShotQuality, a leader in sports data analytics and computer vision technology, has partnered with Fuzzy Yellow Balls (FYB), a renowned online tennis coaching platform, to launch a groundbreaking AI-powered Tennis Serve Grader, Bert AI. This powerful tool identifies the optimal serve that leads to winning more points, transforming the way tennis players improve their game. The product automates the grading of tennis serves by leveraging cutting-edge computer vision (CV), human vision, and data science to deliver precise insights, revolutionizing serve optimization with reliable, data-driven feedback.
ShotQuality x Plannatech
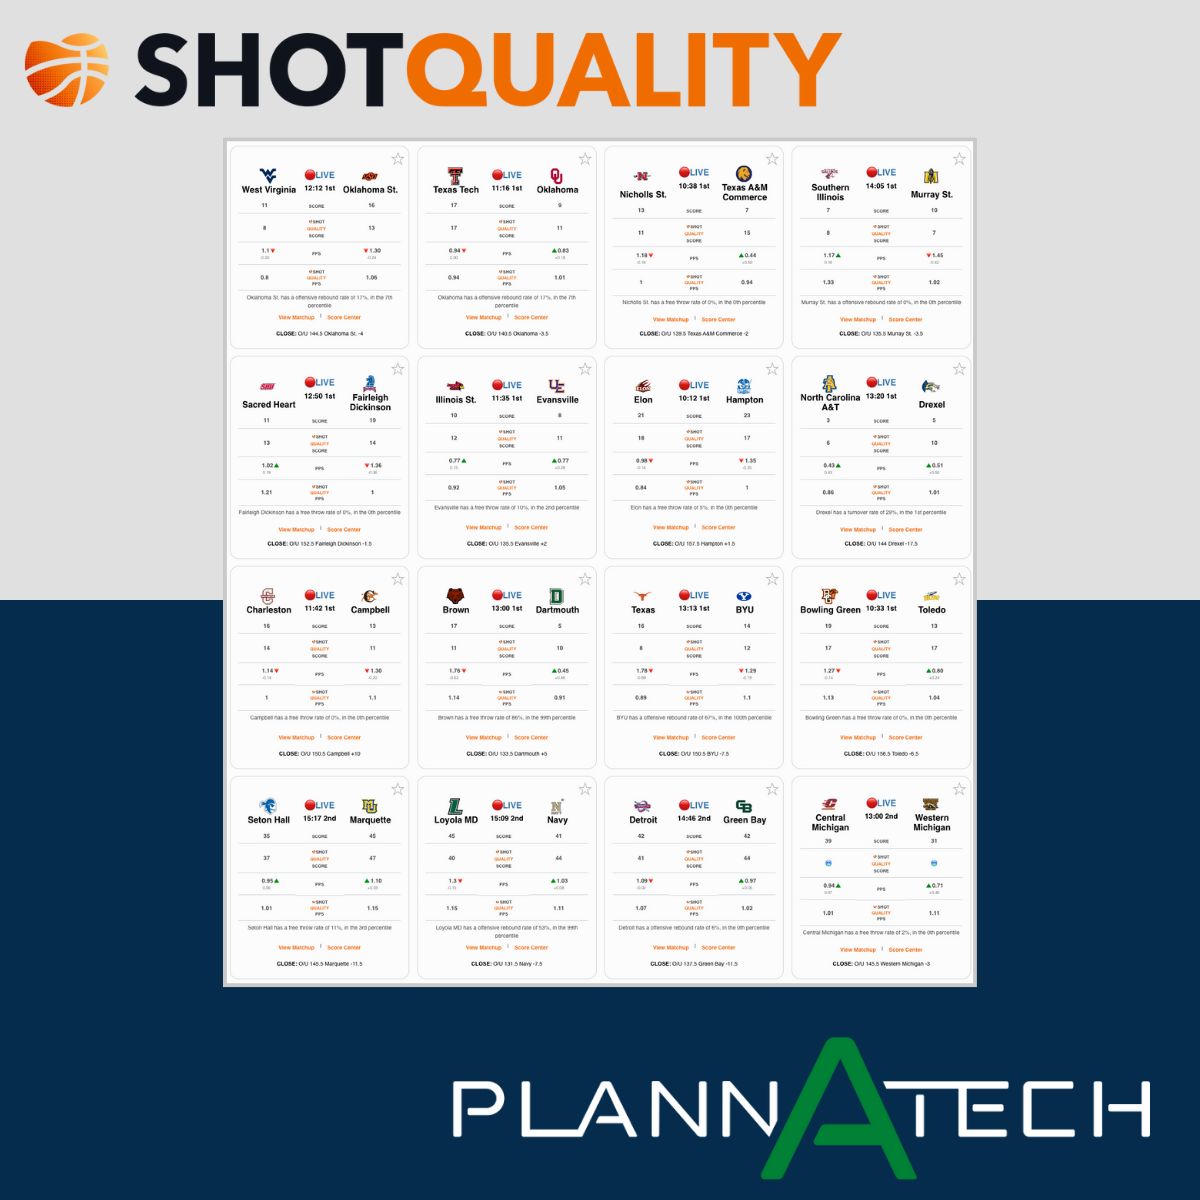
Exciting news!! We are thrilled to announce our partnership with Plannatech who will be utilizing our proprietary player tracking and location data to power pricing for their NBA, NCAAM, and WNBA basketball markets.
WHY THE SHARPEST BOOKS
CHOOSE OUR DATA
Oli Gibbons
Director of Trading & Research, Plannatech
"ShotQuality stands out as the quintessential expert one needs to know in the basketball data arena. Its basketball data offerings are comprehensive, and cater to the wide range of analytical needs required to be a leader in this space."

Benjie Cherniak
iGaming Advisor
"ShotQualty has built one of the most comprehensive datasets in basketball which is becoming a very significant value add for traders and quant teams in the gaming space"
Blog
View All Blogs >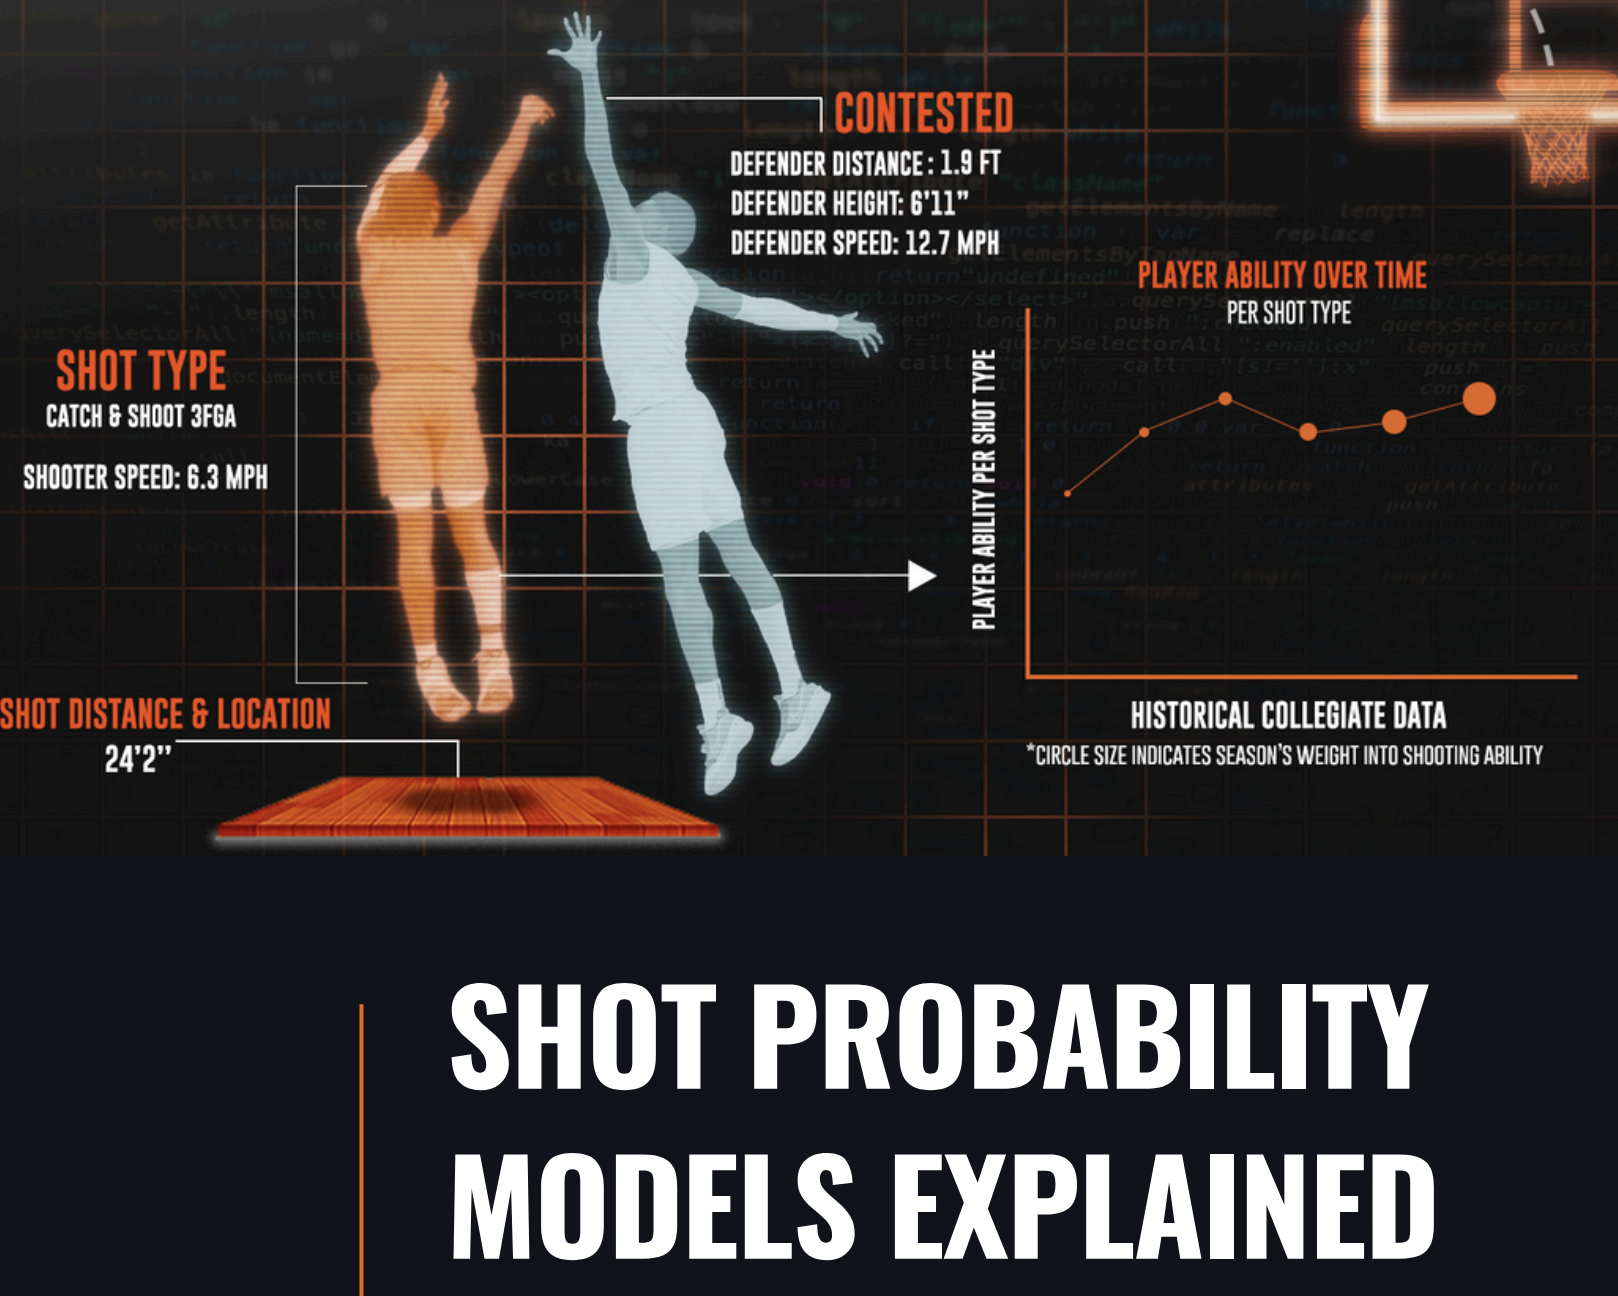
Shot Probability Models Explained
Dive deep in our latest whitepaper about how ShotQuality uses computer vision and AI to generate player location data which drives the most predictive shot models in basketball and the 5 factors which drive shot probability. The Starting 5 📊: 1️⃣ Defensive Distance: How does defensive ability and positioning impact the shot? I.e. the closest defender is eight feet away, there are three defenders within five feet of the defender, Houston plays elite defense, Delaware State plays poor defense. 2️⃣ Shooter Ability and Player Performance: How good is the shooter? I.e. Stephen Curry is an elite three-point shooter, Josh Richardson is average, and Russell Westbrook is poor. 3️⃣ Play Type Descriptors: What happened before the shot? I.e. transition, pick-and-roll, cut. 4️⃣ Shot Type Descriptors: What happened during the shot? I.e. dunk, catch-and-shoot, off-the-dribble, shot distance. 5️⃣ Key Inferences: How can we improve predictions while missing data? I.e. late shot clock shots tend to be rushed, players at Gonzaga tend to be good shooters, tall players tend to be poor free throw shooters.
Finding The Edge
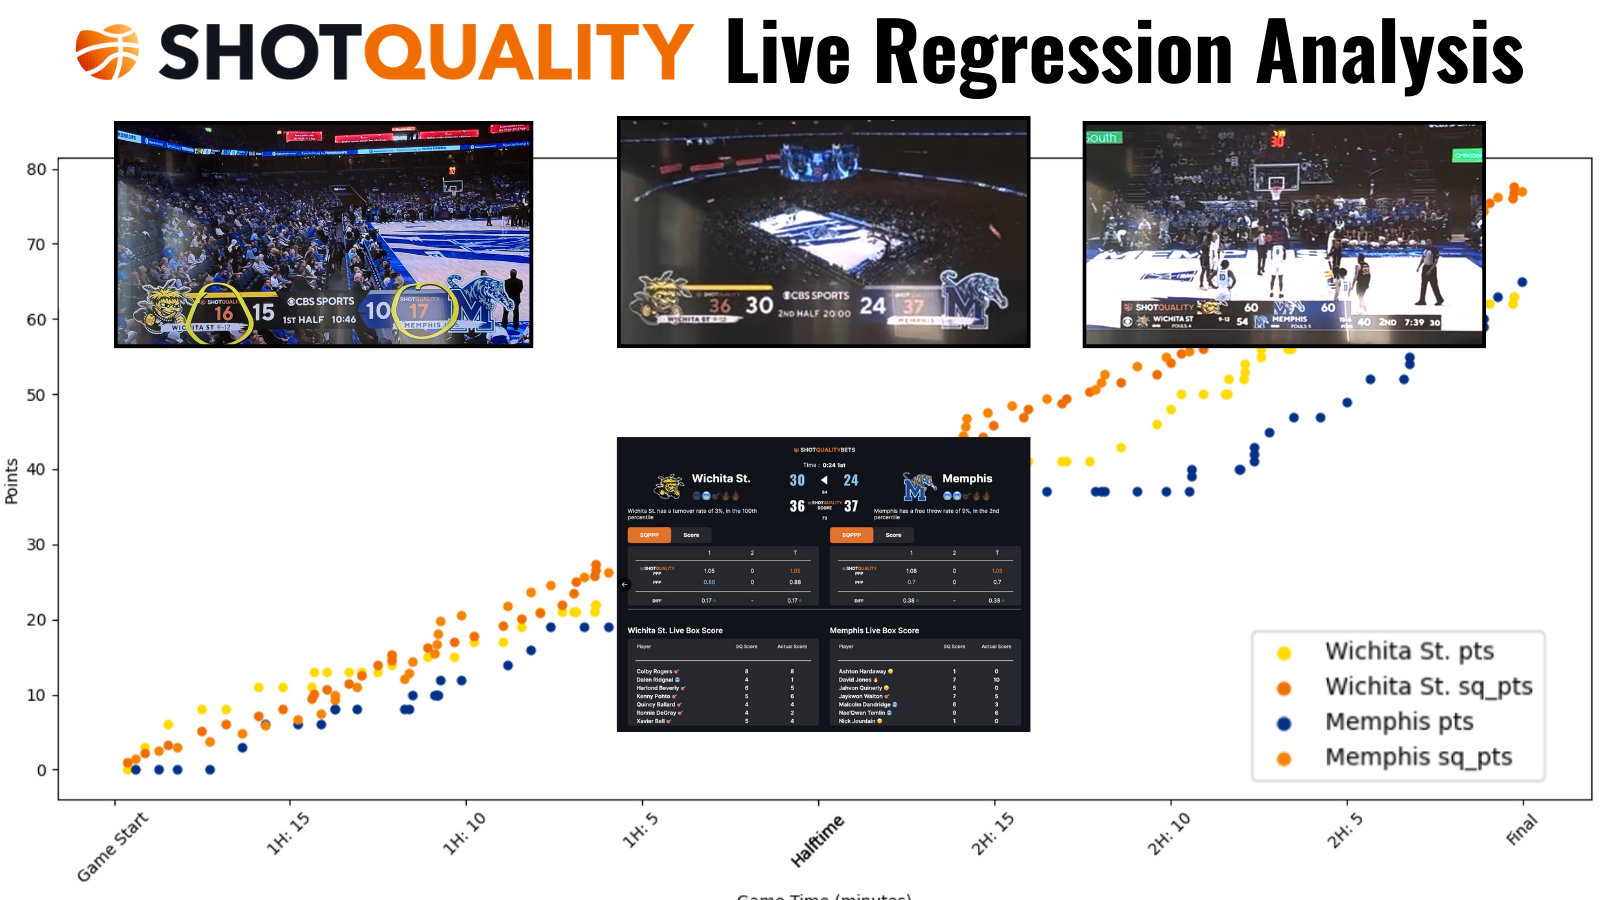
Learn how ShotQuality’s models fuel live regression analysis and how ShotQuality Points in the first half are more predictive for the second half than actual points scored in the first half.
